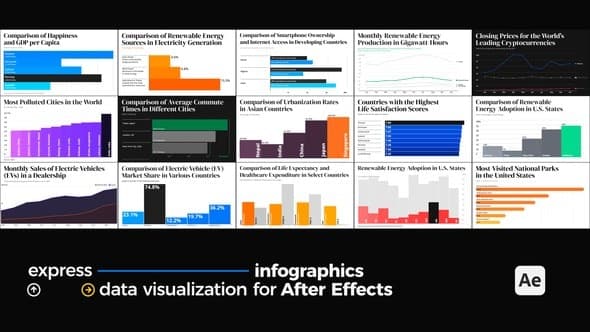
Express Infographics - Data Visualization for After Effects
From Videohive · Added Oct 16, 2026
About this item
Express Infographics – Data Visualization for After Effects
Make the Best Charts with adaptable and modular design. Data Visualization made easy for Adobe After Effects. Three Chart Options. Fast Customization with Essential Graphics or Layer Controls. Minimal design used by the best brands in the World. Combine, Edit, and Personalize every Chart to match your projects.
Three different Chart styles are included for you to choose; Bar, Columns, Lines. Ten values available per Chart. With the Possibility to combine many together. Resizable and adaptable for any screen size, and also suitable for social media and short-form content (YouTube, Instagram, Facebook, TikTok, Snapchat, Twitter, Reddit, LinkedIn, Twitch, etc). Featuring a great number of Controls to allow you to fine tune and customize the style as much as possible.
After Effects Template:
3 CHART Types BAR [LINE]
Essential Graphics Controls
Adaptable and Responsive Design – Time
Complete Modular Setup
Video Tutorial Included
Fully Customizable
For After Effects CC 2022 or Newer
No Plugins Required
Music, Fonts, and Footage:
Free Font Links are included in the Package.
Music from AudioJungle. Link: Funky Jamaica
NOTE
© All Rights Reserved AndiKadiu – Code, Expressions, or Design-Setup from this project can not be used to create likewise items/Templates, and will be subject to DMCA notice and project removal.
More from Videohive




In the price
- All files of the item
- Delivery to your Telegram chat
Not in it
- Refunds, all sales are final
- One-to-one mentoring
- Certificates from the original school